ASTR 222 — Galaxies & Cosmology
Homework 3 — Due 13 April in class
-
Population Synthesis
(You can code this one up in Python, or alternatively an Excel-type spreadsheet would work great for this problem, as well…)
We are going to make galaxies by mixing stars. Here are the four types of stars we are going to use. For each type of star, describe in words what kind of star it is: what evolutionary stage it is in, what kind of lifetime it has, what limits (if any) you can place on its age. Then calculate its stellar mass-to-light ratio (M/L)*.
(Remember that mass-to-light units are solar units, so the Sun has a mass-to-light ratio of (M/L)* = 1 Msun/Lsun. And also remember that the Sun has an absolute magnitude of Mv=4.8 and a B-V color of 0.65.)
Star 1
Star 2
Star 3
Star 4
Spectral Type
A2V
G2V
K5V
K2III
Mv
1.3
4.8
7.35
0.5
B-V
0.05
0.65
1.15
1.16
Mass (Msun)
2
1
0.67
1.1
(M/L)*
Now let’s build some galaxies. The galaxies should each have a total V luminosity of Lv=1010 Lsun. The fraction of V light each star contributes to each galaxy is given in the table below. Calculate the total (aka “integrated”) B-V color and stellar V-band (M/L)* ratio, as well as the fraction of each star by number for each model galaxy. Show your work, by walking through one example by hand in exquisite detail.
Fraction of V-band light from each star
Star 1
Star 2
Star 3
Star 4
Galaxy 1
15%
40%
25%
20%
Galaxy 2
30%
0%
0%
70%
Galaxy 3
45%
25%
20%
10%
Galaxy 4
0%
30%
70%
0%
Galaxy 5
0%
30%
50%
20%
Now, a “typical” color for a spiral galaxy like the Milky Way is B-V=0.7, an elliptical might have a color of B-V=1.0, and a starburst galaxy might have B-V=0.4. Which of these galaxies is a good match for an elliptical, which for a spiral, and which for a starburst? Which two galaxies don’t make sense? Argue your answer both from integrated colors and from the mix of stellar types.
-
The Tully-Fisher Relation
-
In class, we made arguments about why we might expect L ~ v4 for spiral galaxies. Show analytically that if we plotted absolute magnitude against log(v), we would expect this line to have a slope of -10.
-
In general, unless we know the distances of galaxies, we can’t make a Tully-Fisher plot. But we can be crafty and realize that if we look at galaxies in a cluster we can plot apparent magnitude against log(v) and get the same slope. Why?
-
So here is a Tully Fisher dataset for galaxies in the Virgo Cluster (from Pierce & Tully 1988, ApJ, 330, 579). The dataset has
– the NGC number of each galaxy,
– apparent magnitude of the galaxies in the B, R, and I band,
– the inclination of the galaxy to the line of sight (90°=edge on, 0°=face on),
– the observed rotation speed (W20/2) of the galaxies.
We need to make a correction to the data based on inclination in order to get the true rotation speed of the galaxy. What would this correction be? Apply this correction to the observed rotation speeds to get the true rotation speed. -
Make a Tully-Fisher plot (apparent mag versus log(V)) in the B, R, and I bands, and for each case, fit a line of the form m=a×(log(V)-2.5)+b. Report your fit by giving the parameters a and b as well as their uncertainties.
– What is the slope of the line in each case? When is it closest to the “expected” value?
– What is the dispersion around the line in each case?
– Give physical arguments about which band would best define the Tully-Fisher relationship. Think both about stellar populations and dust. -
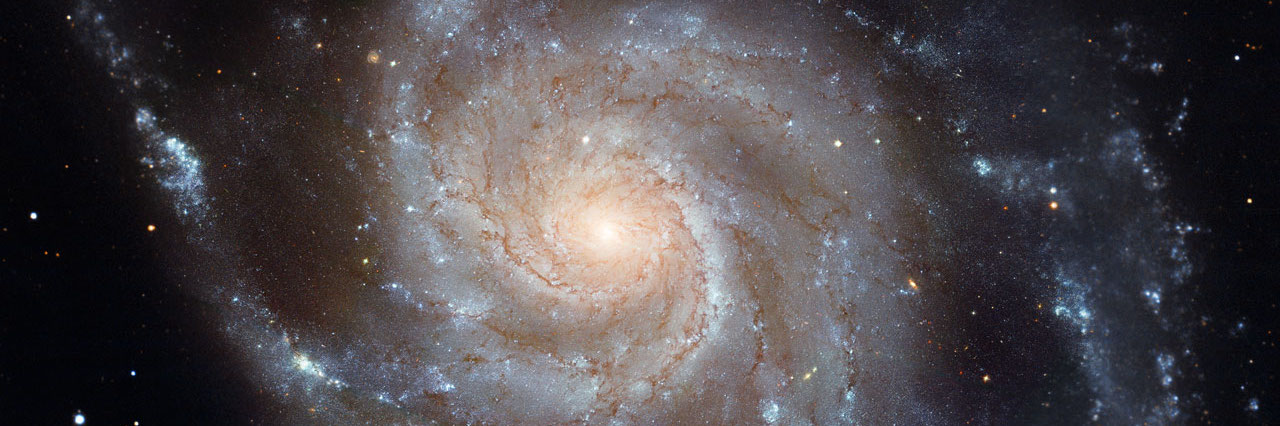
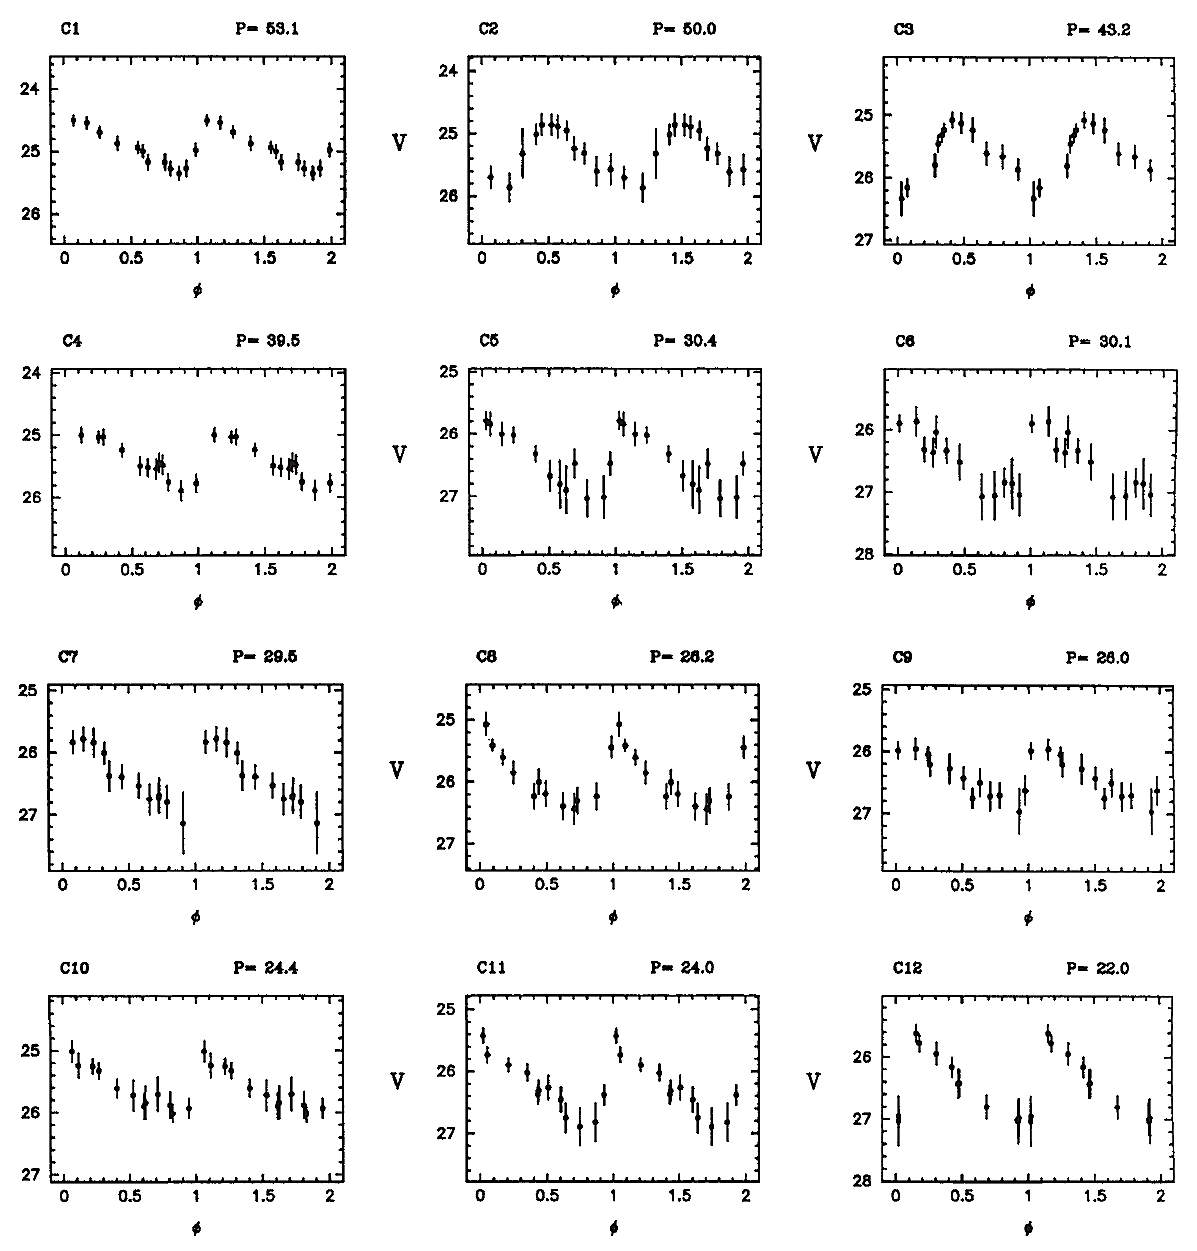
Now we need to calibrate the Tully-Fisher relationship. We want to know how absolute magnitude depends on circular velocity, which means we need to know a distance to the Virgo cluster. Using the Hubble Space Telescope, we observe Cepheid variables in M100, also known as NGC 4321. Here are the reduced light curves (from Freedman etal 1994, Nature, 371, 757). These are plots (one for each detected Cepheid) of apparent magnitude on the y-axis and time in days (“phi”) on the x-axis. The derived period is shown in each frame as “P=xx”. Using the Cepheid period-luminosity relationship given in class – (M=-2.43×log(P)-1.62) – calculate a distance estimate to M100 for each Cepheid and then average them to give your best estimate for the M100 distance. Also give a statistical uncertainty to your distance.
-
Using this distance, calibrate the Tully-Fisher relationship. You had a T-F relationship that connected apparent magnitude (m) with log(V), and now you know the distance to Virgo to turn apparent magnitude (m) into absolute magnitude (M), so you can rewrite your T-F relationship now in terms of absolute magnitude: M = a×(log(V)-2.5) + b. What are a and b, and their uncertainties?
-
What do you feel are the main sources of uncertainty, both systematic and random, in your derivation of the T-F relationship?
-
Now you are looking at a spiral galaxy in the Coma cluster. It has an I-band apparent magnitude of 13.5, an observed rotation speed of 180 km/s, and an inclination of 65°. What is the distance to Coma? What is the uncertainty in your distance?
-
-
The Fundamental Plane
-
Here is a table of data for elliptical galaxies (Bender, Burstein, & Faber 1992, ApJ, 399, 462):
–the catalog number of the galaxy (ngc)
–the effective radius (re) in kpc
–the velocity dispersion (σ) in km/s
–the mean surface brightness (I), converted to linear units of Lsun/pc2Plot, fit a straight line, and calculate the scatter in the two relationships:
log(re) vs log(σ)
log(re) vs log(I)(You should always have log(re) on the y-axis and the other variable on the x-axis, so that in every case you are measuring the scatter in log(re). Also remember that “log” means “log10”.)
-
Now we want to show that the fundamental plane relating the three quantities is a much better fit than any of the above relations which involve just two of the quantities. The expression (#1) for the fundamental plane given in class was re ~ σx Iy, where x=1.24 and y=-0.82. Plot log(re) vs log(σx Iy), fit a straight line, and calculate the dispersion around the Fundamental Plane. Compare that dispersion to those in the previous plots involving just two parameters.
-
Okay, in the rest of this we are going to ignore constants and work simply with variables - r, M, σ, I, L, etc. That means that I don’t want to see any π’s, 2’s, G’s or anything else running around your work (except for the exponents on the variables). Don’t worry about the fundamental plane for this part:
–Write down an expression (#2) for how mass depends on velocity and size.
–Write down an expression (#3) for how luminosity depends on surface brightness and size.
–Combine #2 and #3 to show how the mass-to-light ratio of the galaxy (M/L) depends on σ, I, and R (#4) -
Now bring the fundamental plane in. Use expressions #1 and #4 to derive the expression (M/L) ~ LaIb. b should turn out to be a very small number (<0.05), meaning that the mass-to-light ratio is very insensitive to surface brightness, and that to a very good approximation, the mass-to-light ratio of an elliptical galaxy depends primarily on its luminosity.
-