The first nice plot I made was a two dimensional density plot of sigma
vs. radius, shown below:
Now, to make the above image you need to use both SM and IRAF. First,
make sure you are in my data_dumps directory.
1. load SM and type 'macro read "../usefulmacros.in"' to load in my package of
macros.
2. type 'signew' to run the macro.
3. wait while the program runs (takes ~10 minutes)
4. logon to IRAF, then move to the data_dumps folder.
5. type 'rtext [filename] [filename].fits header- dim=[bin,bin]'
where 'bin' is what you entered for "how many bins on a side" and
'filename' is what you entered for "enter the main filename".
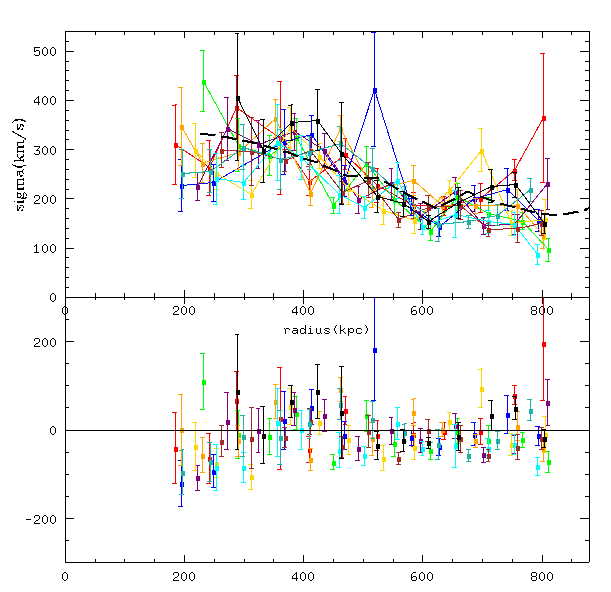
the next image is of several iterations of a macro that places
'fields' on the data, then calculates the velocity dispersion as a
function of r, plots it, and then caculates the residual based on the
dispersion of all the appropriate points in the cluster.
Making this one is simple, and requires just an SM macro. You need to
be in the /fromcraig/programs directory for this one.
1. load SM and type 'macro read "../../usefulmacros.in"' to load
the package in.
2. type 'fieldresid' to run the macro.
3. enter the parameters you'd like (the filename can be anything,
it creates the fields as it goes) and sit back and watch.
Finally, there's this image, of average variance vs. the average
number of points:
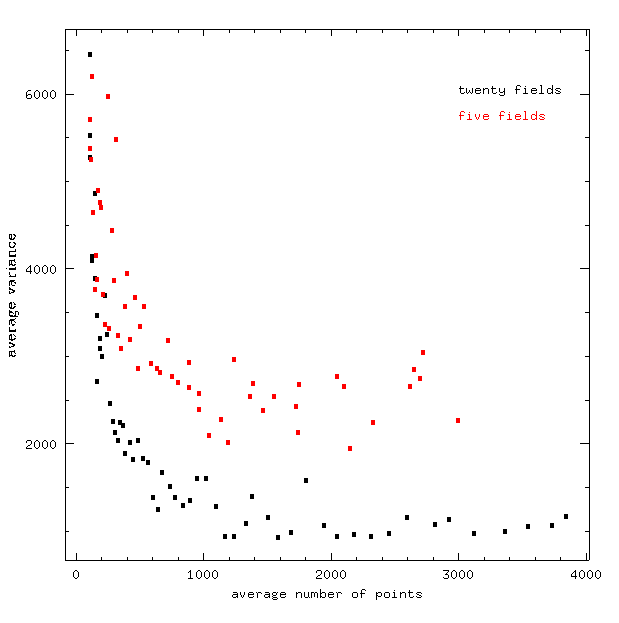
This plot is very similar to the previous one, but involves a slightly
different macro and a couple extra steps.
1. load SM and type 'macro read "../../usefulmacros.in"' to load
the package in.
2. type 'lottaresids' to run the macro.
3. enter all the parameters, then wait for the macro to run.
4. after its done running, if you want to go into the folder
/fromcraig/programs and change the name of the file called
lottaoutput.dat to something more meaningful, especially if you want
to keep the data from that run of the program
5. repeat for a couple different numbers of fields (or switch around
other parameters), then load the renamed lottaoutput.dat files into
SM.
6. the average variance is in the first column of the
lottaoutput.dat files, and the average number of points is in the 4th
column.
7. plot however you'd like.
back