The Surface Density Profile of the Galactic Disk from the Terminal Velocity Curve
Addenda
The Milky Way is such a deep and fascinating subject, there were many comments offered by colleagues
that did not make it into the published paper. Here I offer a few addenda.
Context
For the purposes of dynamical modeling, it is conventional to assume an that the disk of the Milky Way
is purely exponential and static. In practice, neither of these are likely to be true - the
surface photmetry profiles of external spiral galaxies are tolerably described as exponential disks,
but there are real deviations from this approximation: bumps & wiggles caused by spiral structure.
The spiral arms that cause the bumps & wiggles in the luminosity profile are themselves dynamically
live entities, so the assumption of a static potential is also dubious. Nevertheless, these make a good
starting point.
The point of this paper is to take a step beyond the
assumption of a purely exponential disk, and infer the surface density profile required to fit the
terminal velocity curve. This implies a dynamically live disk, which is not considered: the approximation
of a pure exponential is relaxed, but the fiction of a static axisymmetric disk is maintained, despite
the apparent m=2 difference between first and fourth quadrants.
One step at a time.
Goodness of Fit
In the published paper, I refrained from computing a χ2 value or other measure of the goodness of fit.
This is because the formal uncertainty in the terminal velocity measurements is 2 km/s while the systematic
uncertainty is probably of order ~10 km/s. There are contributions to this systematic from [at least] the systematic
(and covariant) uncertainty in the Galactic Constants (R0,Θ0), the non-circularity of
orbits, and turbulence in the ISM. While I can make a plausible estimate of the magnitude of the
systematic uncertainty, I do not know it well enough to include in a statistical analysis. Anyone who claims
to be able to do this at present (2015) is fooling himself. Perhaps Gaia will help sort this out.
Nevertheless, for a given choice of Galactic Constants, it is interesting to compare the goodness of fit provided
by different models. For illustration, I have taken the models I've fit to the fourth quadrant terminal velocity
data, and used them to predict the vertical force measured by Bovy & Rix (2013).
In turn, I've taken the exponential disk model Bovy & Rix fit to the vertical forces and
used it to predict the rotation curve (using their assumptions about the gas disk and bulge mass).
 |
|
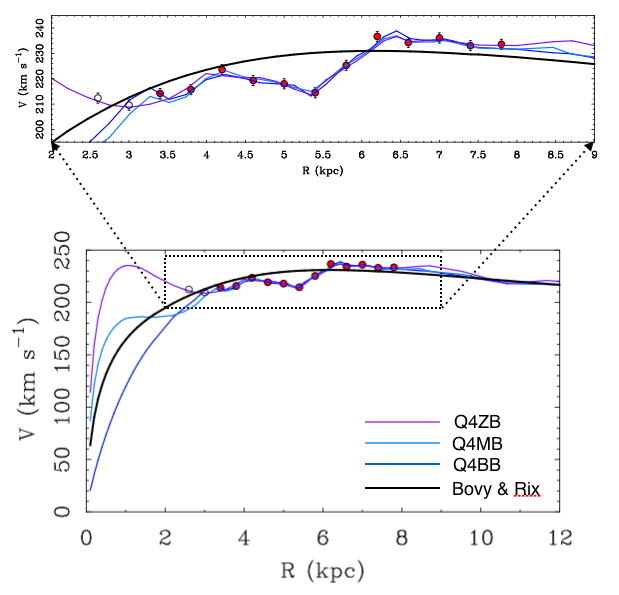
The rotation curve of the Milky Way from the 4th quadrant CO data of Luna et al. (2006, red points)
together with the 4th quadrant models with various bulge fractions (blue lines) fit to these data.
Open points at small radii have been omitted from the fit for presumptive non-circular motions due to the bar.
Also shown is the rotation curve of the model of Bovy & Rix (2013) fit to the vertical restoring force (black line).
|
 |
|
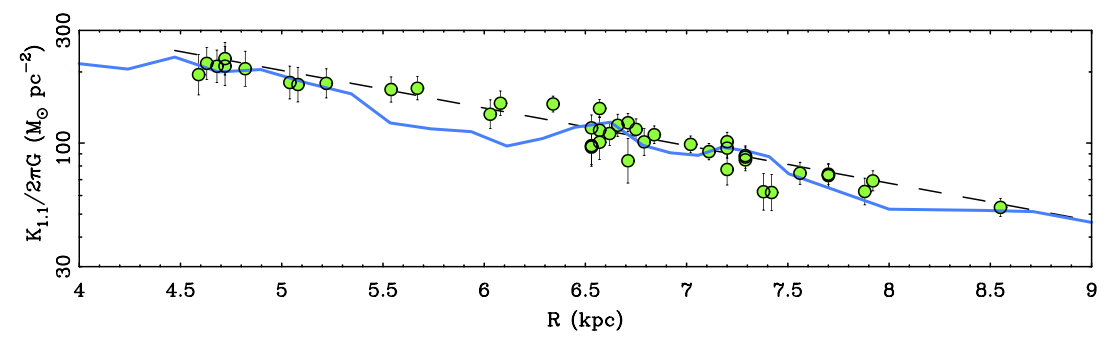
The vertical restoring force measured by Bovy & Rix (2013, green points) together with their exponential disk fit
thereto (dashed line). The blue line shows the prediction of model Q4MB; the other 4th quadrant models are similar.
The vertical force follows with no adjustement or fitting: there are no free parameters.
|
These independently constructed models, fit to different data, are in basic agreement (see Figure).
Indeed, both the shape and amplitude of the rotation curves are in as good agreement as could be hoped.
The only real difference is in the details. χ2 does care about details.
| Reduced χ2 values |
|---|
| Model | V(R) |
V(R) excluding
Centaurus Arm |
KZ(R)
| KZ(R) excluding
Centaurus Arm |
|---|
| BR13 | 14.35 | 6.06 | 0.75 | - |
| Q4MB | 0.60 | - | 1.69 | 1.02 |
First, both models provide good fits to the data to which they were fit.
They provide less good fits to the data to which they were not fit.
Nevertheless, the bumps & wiggles model (Q4MB here, but the essential elements were already published in McGaugh 2008)
does a considerably better job of describing the vertical force than the Bovy & Rix model does of describing
the terminal velocities, at least if we take the formal uncertainties at face value.
The data of Bovy & Rix (2013) chiefly probe Galactic longitude ℓ = 0° (Bovy, private communication).
The terminal velocities probe the tangent points, which deviate from this line most strongly
at ℓ = 45° (R = 5.7 kpc for R0 = 8 kpc), exactly where
both models fit worst. This is where the Centaurus spiral arm appears as a strong feature in the fourth quadrant
that is not apparently reflected in the vertical force data along ℓ = 0°. I have therefore recomputed
χ2 with this region excised. The bumps & wiggles model does an excellent job of predicting the
vertical forces outside the region affected by the Centaurus arm. In formal terms, it gives a better simultaneous
fit to both the radial and vertical forces.
Binney & Piffl
Between submission and acceptance, this related paper by
Binney & Piffl appeared. A casual reading might leave the impression that we come to opposite conclusions
about the disk scale length and adiabatic compression. This is not really the case.
Binney & Piffl obtain a rather long scale length for the disk in order to respect the terminal velocities.
Obviously the short scale length I find also fits the terminal velocities, as these are the data I fit to.
I achieve this by dropping the assumption of a disk that remains purely exponential all the way to the center,
where there must be some trade off with the bulge mass. Binney & Piffl achieve this by stretching the
scale length. Both approaches suppress the central mass surface density of the disk, thereby allowing for
a bulge component without exceeding the observed terminal velocities. The scale length I quote only
refers to the regions outside the break radius (which bears at least a passing resemblance
to the K-band profile of Kent et al. 1992).
If I ignore the break and force fit a
single exponential all the way to the center, I get scale lengths in the range 3.4 - 3.6 kpc
(depending on quadrant and bulge mass) which is comparable to the 3.66 kpc quoted by Binney & Piffl.
Binney & Piffl find it impossible to reconcile an adiabatically compressed NFW halo with the data.
I do find that I could (almost) fit such a halo, but only in the limit of negligible bulge mass.
I have not been able to find a satisfactory solution as I let the bulge mass approach that assumed by
Binney & Piffl. Nor do I think it will help to call the bulge a bar. There is a central concentration
of stellar mass that leads to overcompression of the halo if we start from an initially cuspy NFW form
without further invocation of feedback or whatever process d'jour is imagined to fix this fundamental problem.
So again, for the same assumptions, we find the same thing.
Bottom line: we're really saying pretty much the same thing, just from a different perspective.
Indeed, our models are in very good agreement in terms of baryonic mass. They also agree about the
peak velocity (where the baryons contribute the most to the total rotation). They do differ slightly
in the outer, quasi-flat velocity. In my model, the rotation curve declines slowly such that
Vf < Vp, whereas in the model of Binney & Piffl Vf ≈ Vp.
The difference is not great, but it stands out clearly in the Tully-Fisher plane. This re-emphasizes the
utility of applying constraints from external spirals on models of the Milky Way.
These prefer the Milky Way to be on the smaller side of the currently allowed range of R0
(see Olling & Merrifield 1998).
 |
|
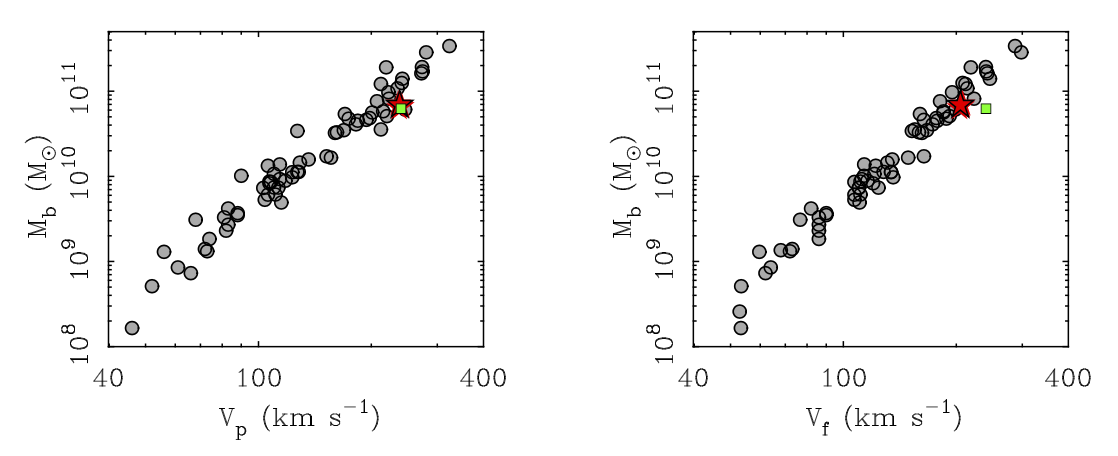
The Baryonic Tully-Fisher Relation (Fig. 9 in the paper) with the model of Binney & Piffl added (green square).
Their model is in good agreement with mine (red star) when the velocity at the peak of the baryonic contribution
is used as the velocity measure (left) but rotates faster further out (right).
|