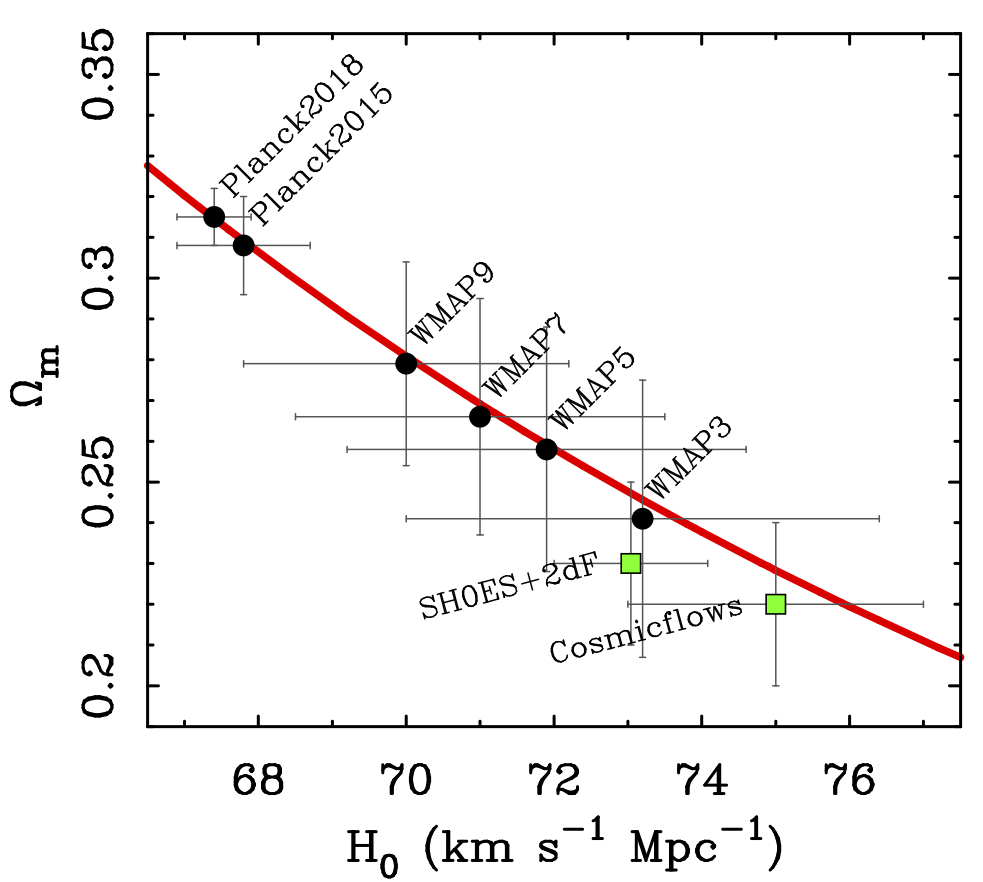
The value of the Hubble constant covaries with mass density in CMB fits
to keep the product Ωmh3 constant (red line).
The best fit value has progressively diverged from the LCDM concordance
region (green points) over time.
| Year | Experiment | H0 | uncertainty |
|---|---|---|---|
| 2006 | WMAP3 | 73.2 | 3.2 |
| 2008 | WMAP5 | 71.9 | 2.7 |
| 2010 | WMAP7 | 71.0 | 2.5 |
| 2012 | WMAP9 | 70.0 | 2.2 |
| 2013 | Planck13 | 67.9 | 1.0 |
| 2015 | Planck15 | 67.8 | 0.7 |
| 2018 | Planck18 | 67.3 | 0.5 |
The Hubble tension has emerged as the best-fit CMB value has decreased from H0 = 73.2 km/s/Mpc in 2006 to 67.3 km/s/Mpc in 2018 with a simultaneous reduction in the formal uncertainty. The latter drives the tension, but why did the best-fit value change so much?
In contrast, the best local measurements of the Hubble constant have remained steady in the low 70s since the turn of the century, from the HST Key Project (72 in 2001) to Friedman's CCHP (69.8 in 2019) to ongoing programs like Riess's SH0ES (73) and Tully's CosmicFlows (75). While it is devilishly hard to reduce the uncertainties below 1 km/s/Mpc, there does not appear to be any credible evidence of the sort of systematic errors that plagued the field in the twentieth century at the level that would be required to explain the discrepancy.
The value of the Hubble constant covaries with mass density in CMB fits
to keep the product Ωmh3 constant (red line).
The best fit value has progressively diverged from the LCDM concordance
region (green points) over time.
The temporal variation of the CMB values tracking the systemic covariance seen in the figure suggests that something in the CMB fits is to blame rather than some systematic error in local measurements. One possibility is that the massive galaxies seen by JWST at high redshift grew too big too soon, as predicted, throwing off the calculation of gravitational lensing used in CMB fits.