CDM & MOND rotation curve fit
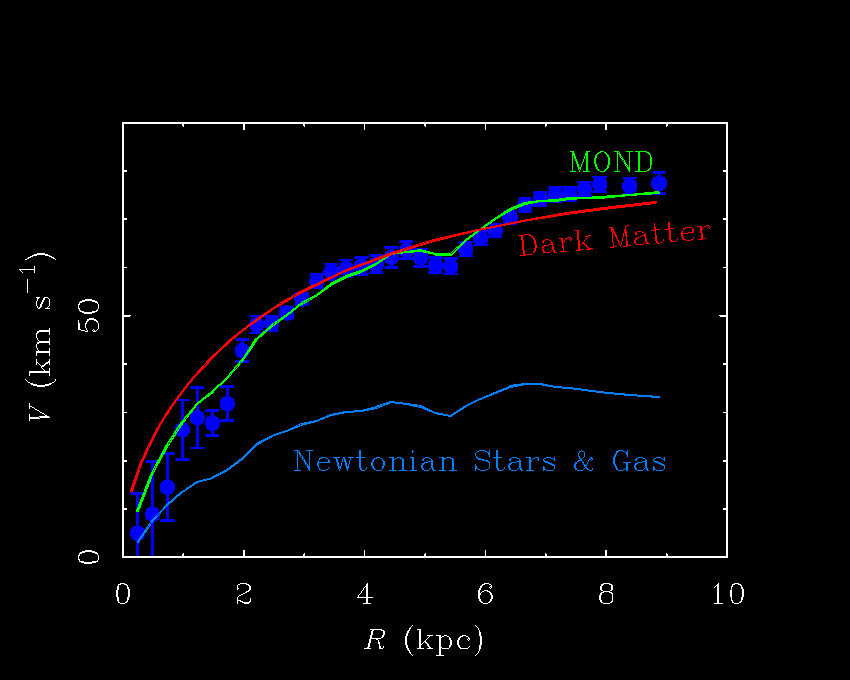
This plot shows the observed and baryonic rotation curve of the nearby gas rich dwarf galaxy NGC 1560 (Broeils 1992). Two fits to the rotation curve are shown: MOND (Begeman, Broeils, & Sanders 1991) and CDM (Sellwood & McGaugh 2005). [This plot was adapted by this Physics World article.]
The MOND fit reflects the shape of the baryonic distribution, which is reflected in the shape of the rotation curve. The stellar mass is fairly insignificant in this gas rich galaxy, playing a fairly minor role in matching the shape of the inner part of the rotation curve. The fit is quite sensitive to the distance, however: Begeman et al. did not find a good fit for the D = 3.0 Mpc available in 1991. They suggested that a good fit would be obtained if D = 3.4 Mpc. This was derided by some as too many free parameters, which is somewhat true (albeit still fewer than we have with dark matter). The modern distance to this galaxy, measured by the tip of the red giant branch method, is 3.45 Mpc (Karachentsev et al. 2004).
The CDM fit is not unique. The fit shown assumes a primordial NFW halo with a proper treatement of adiabatic contraction. Other things could be done, but this is the most rigorous attempt to date. More generally, CDM predicts a broad band, almost all of which lies to higher velocity than observed (the concentration problem, sometimes misdescribed as the cusp/core problem). Its prediction is more vague than that of MOND, and misses the mark by a wider margin. If we are convinced that CDM is correct, it is easy to look at this and say "close enough!" but the sad fact is that CDM is still very far from making predictions that are either as rigorous or as successful as MOND on galaxy scales.