For many years, LSB galaxies were thought not to exist, but this proved to be a selection effect. Many examples have now been discovered. Indeed, LSB galaxies have become central to many areas of research as they provide new insight into theories designed to explain brighter galaxies. The data for LSB galaxies bends and sometimes breaks some of our cherished ideas about the universe.
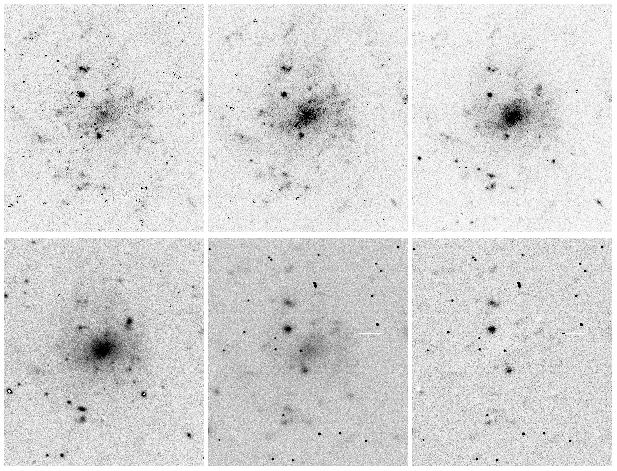
The LSB galaxy UGC 1230 in various wavelengths: from left to right, U, B, V (top); I, Hα, continuum subtracted Hα (bottom). Loose spiral arms are apparent in the bluer bands; a color gradient is obvious to the eye. The overall colors are quite blue, typical of late type LSB galaxies. There is some sporadic star formation, indicated by the isolated HII regions (McGaugh & Bothun 1994). |
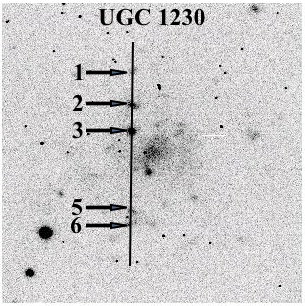
Position of slit for spectroscopic observations of HII regions in UGC 1230 (McGaugh 1994; Kuzio de Naray et al. 2004). |
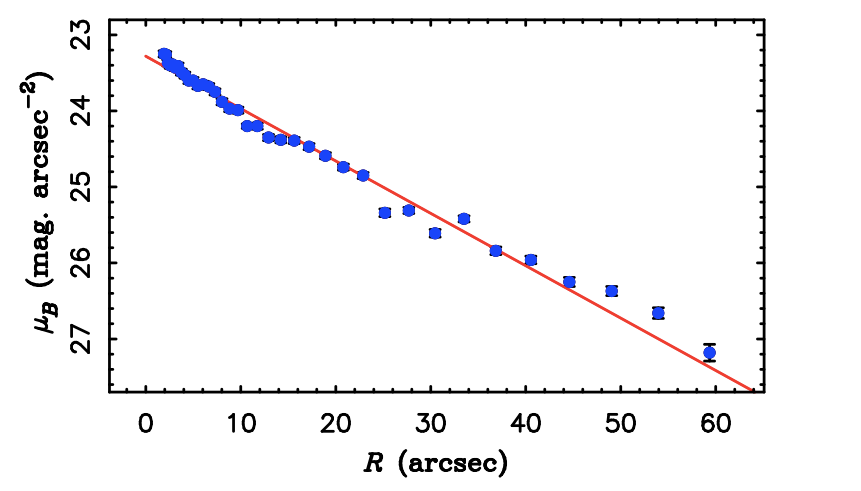
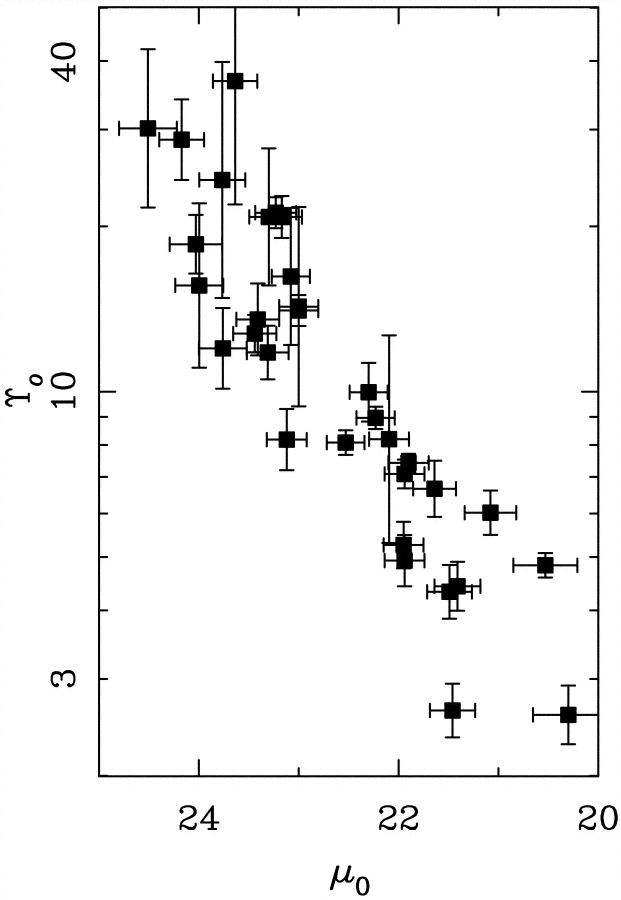
The surface brightness profile derived from the B-band image of UGC 1230. Note that the central surface brightness does not exceed 23 mag. arcsec-2, well below what was once thought to be the "universal" (Freeman) value of 21.65 mag. arcsec-2. The scale length of this galaxy is 3 kpc, comparable to the Milky Way. It is not a tiny dwarf. |
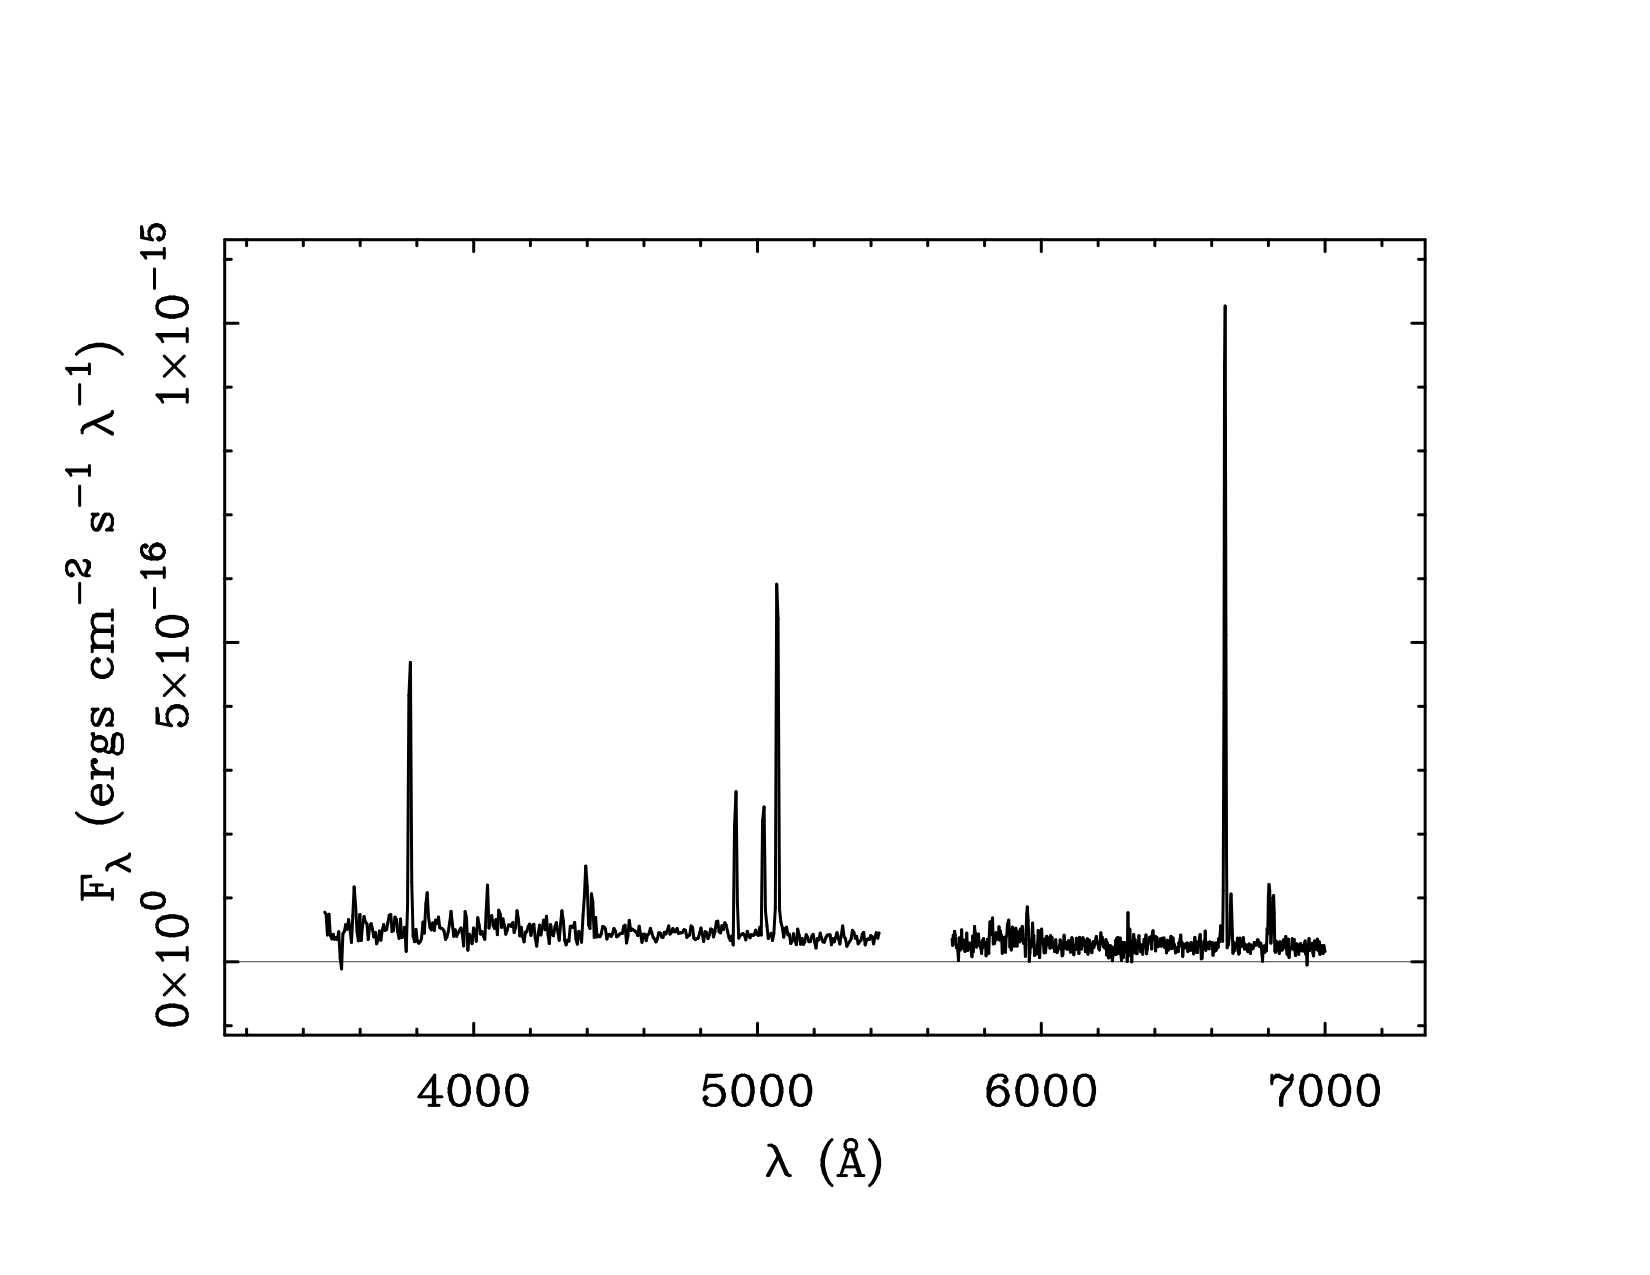
The spectrum of one of the HII regions in UGC 1230 showing the bright emission lines of oxygen and hydrogen. These allow an abundance estimate to be made, showing that LSB galaxies are metal poor. |
See more at Jim Schombert's website.
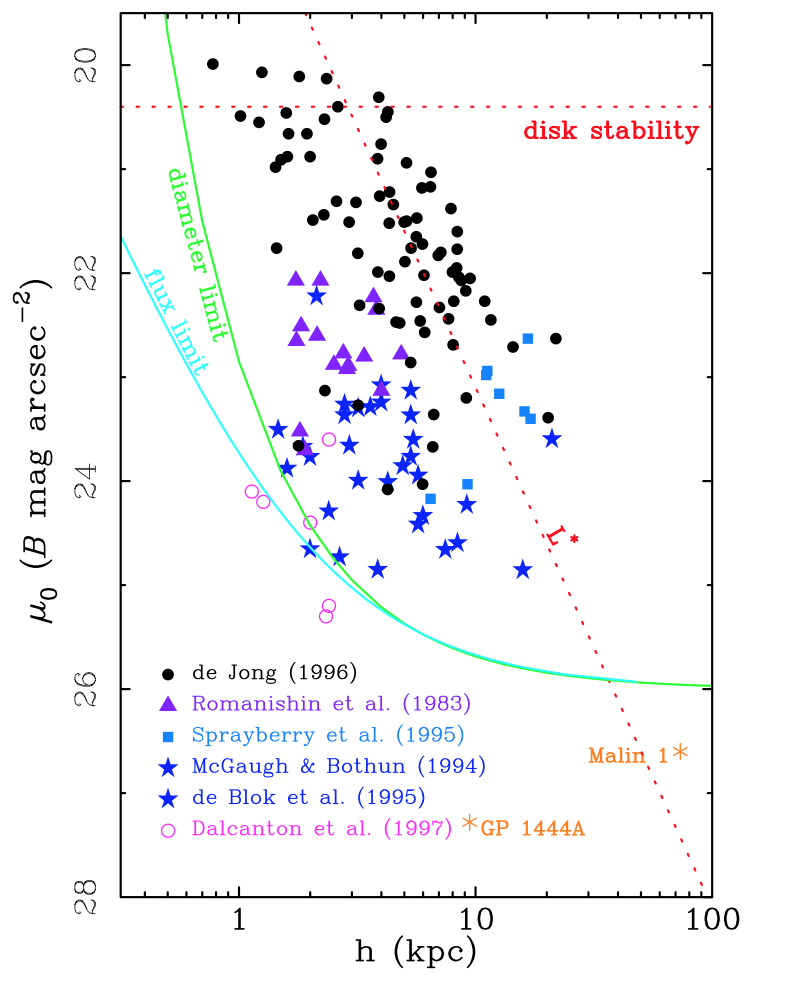
The size and surface brightness of disk galaxies as quantified by exponential disk fits, showing the central surface brightness in the B-band against the disk scale length. The data show the progression towards discovery of lower surface brightness galaxies as surveys press deeper. Solid lines show the theoretical limits of a hypothetical very deep survey. The diagonal dotted lines shows the luminosity of an L* galaxy whicle the horizontal dotted line shows the apparent threshold for disk stability. |
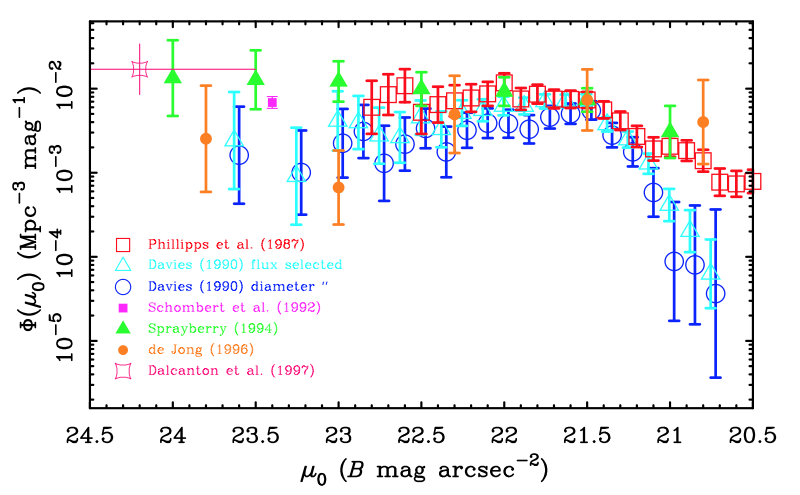
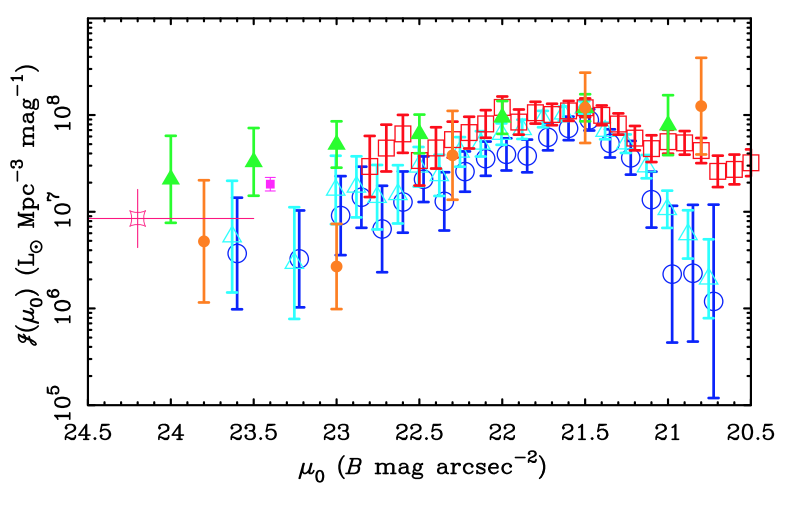
The number density (top) and luminosity density (bottom) of disk galaxies as a function of central surface brightness. The disk stability line at left corresponds approximately to the classic "Freeman Law." Rather than all disks sharing this surface brightness, Freeman's limit is an upper limit to disk surface brightness above which the numbers of galaxies declines rapidly. Below the Freeman limit, there are approximately constant numbers of galaxies at each surface brightness (top). These are, on average, less luminous than higher surface brightness galaxies, so their contribution to the luminosity density declines steadily (bottom). |
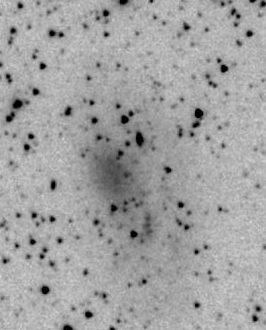
The mass-to-light ratio enclosed by galactic disks as a function of absolute magnitude. Fainter galaxies tend to require more dark matter, but there is considerable real scatter in the mass-to-light ratio at a given absolute magnitude. |
The enclosed mass-to-light ratio as a function of central surface brightness. Lower surface brightness disks are progressively more dark matter dominated. This correlation appears to be the sole driver of the weaker correlation with absolute magnitude. |
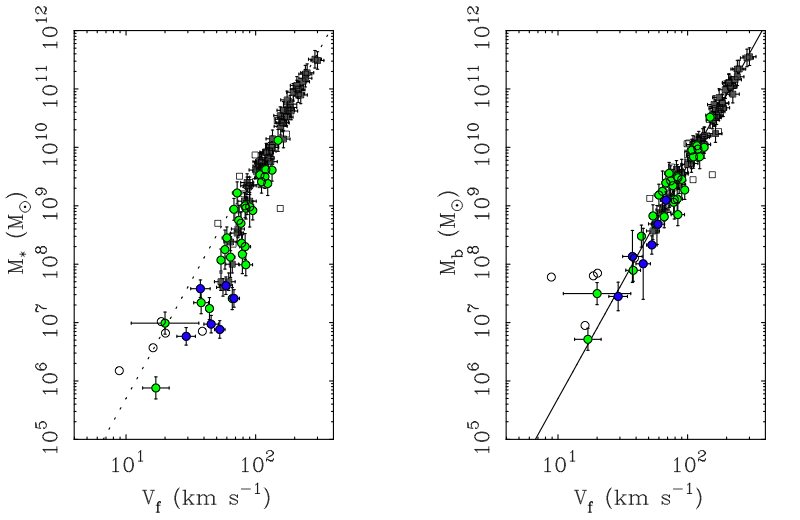
The stellar mass (left) and baryonic (right) Tully-Fisher relations. The baryonic mass is the sum of stellar and gas mass. Originally a relation between line-width and luminosity, the underlying physical variables appear to be rotation velocity and baryonic mass. Physics does not care whether the mass is in the form of stars or gas. If an important part of the total is omitted, the relation appears to break down. Low mass galaxies are frequently gas rich (colored points have more than half their baryonis in the form of gas), and deviate from the stars-only relation (left panel). Adding the gas into the total baryonic mass restores a relation that is continuous over five decades in mass.