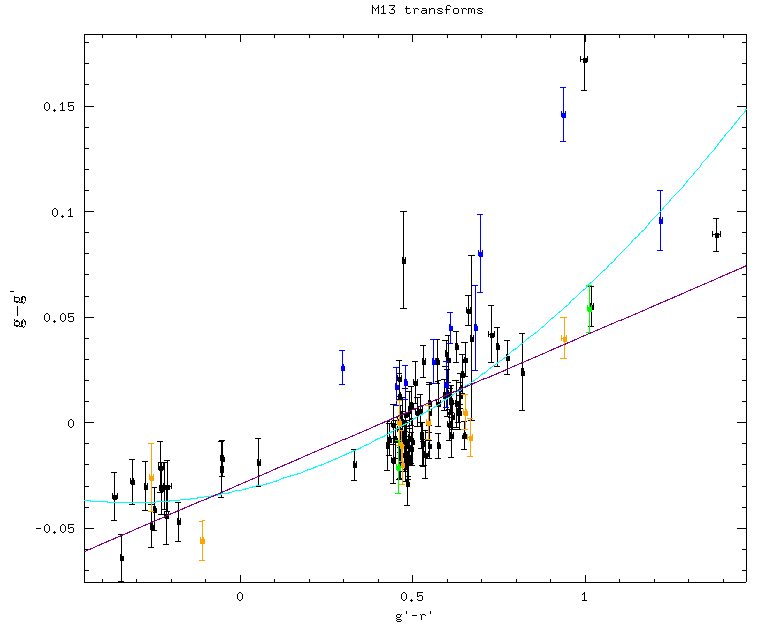
This plot is the same format as the last one. Note that there are no red points, as no points were found
in that pixel range. The linear fit to this graph is y = .07046*x - .02908. The quadratic fit is y = -.03194 + .03721*x + .05854*x^2.
The linear fit has similar values as for the 5th frame, but the quadratic is somewhat different.