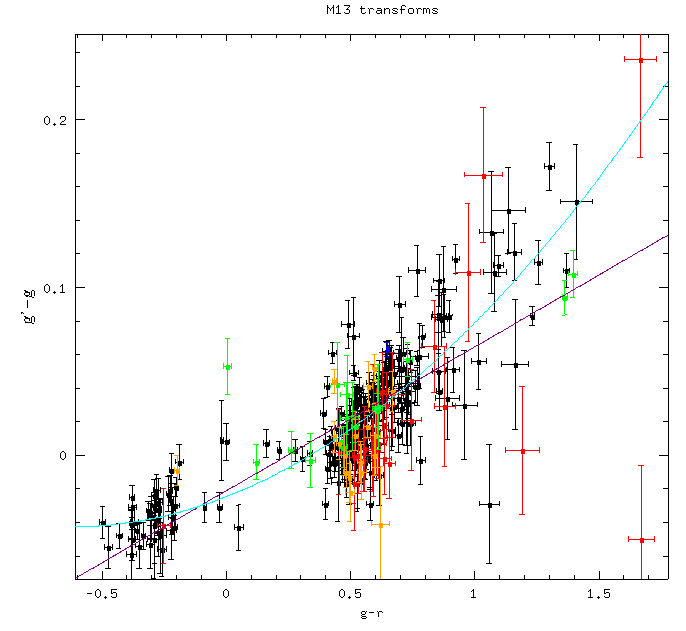
This plot is of the sixth frame of Jen, which contains the purple colored points in this plot.
It is the same format as the plots from yesterday, except that now the axes are g-r and g'-g.
The linear fit to this graph is y = .08573*x - .02109. The quadratic fit is y = -.02461 + .05756*x + .04604*x^2.
This plot was made primarily so I could compare our values to the transforms given in Clem, page 47. The linear fit does not give
similar results as in Clem, unfortunately.

