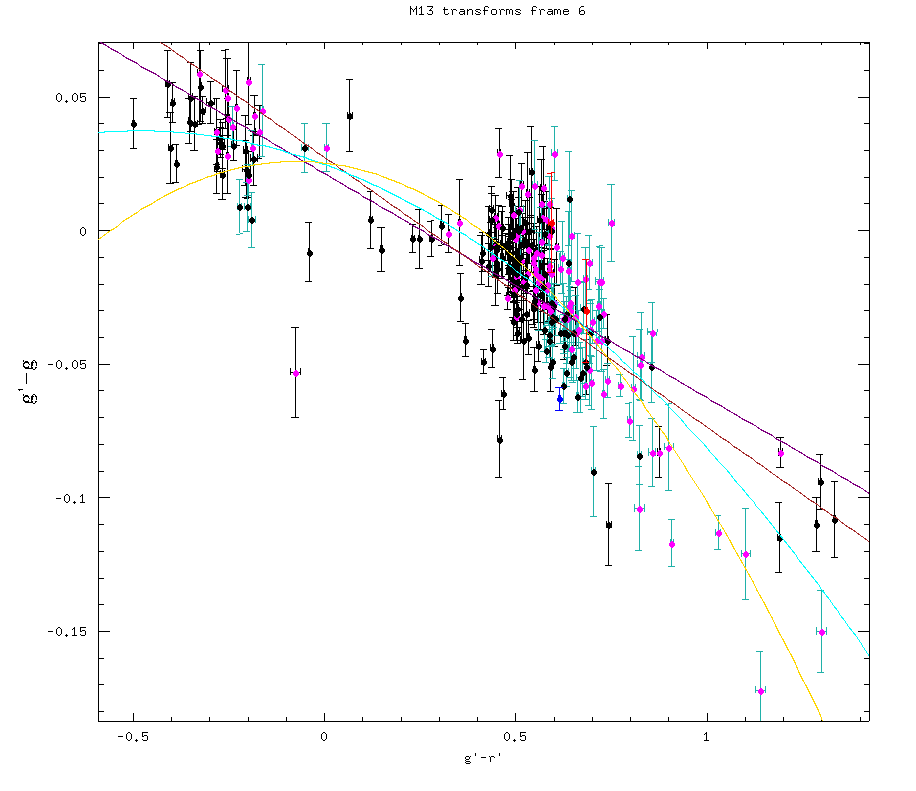
The 6th frame of Jen. Again, no y-axis cutoffs. Has the elements of these three
plots combined. There are also four fits; the purple and cyan are for the middle points
in the frame, like in the previous plots, and the brown and gold are for the points with high probability for cluster membership.
The purple linear fit is of the form y = -.08391*x + .02134, the brown linear fit is y = -.10094*x + .02737, the cyan quadratic fit follows
y = .02473 - .0522*x - .05395*x^2, and the gold quadratic fit is of the form .0253 - .01646*x - .1104*x^2.

